Putting Practice: Hypothesis Testing

Hello Hyzermetricians, for tonight’s post I will be shining an insanely bright light on the latest video from my Instagram Live Garage Putting Series.

Alright, let’s set the stage. If you haven’t seen my live putting sessions before, most of them consist of fifty putts. Sometimes I bring in obstacles or I move the basket up onto a stair to mix things up, but for the purposes of last night’s video, I attempted 50 straightforward 19-foot putts.

I’d love to think that I should make 100% of these 19-footers, but sadly that is not (yet) the case. Instead, I hypothesized that my true putting percentage from this range was 95%. The rest of this post explains how I used my putting session last night to create a test of this hypothesis, and how you can perform a similar test too!

Suppose for a second that my hypothesis is correct, I am indeed a 95% putter from 19 ft. That doesn’t mean that I will always make 95% of my putts whenever I shoot a video. In fact, if I only attempt 50 putts at a time, it’s impossible to make exactly 95% of my putts. In some of my putting videos I’ll make more than 95% of my putts, in others I’ll make less. Given this variability, and the fact that I don’t actually know my true putting percentage, how can I ever determine if my hypothesis is accurate? Let’s find out. Roll the video!

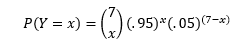
For starters, let’s look at the first seven putts from the video, of which I made five. It doesn’t take a math wizard to know that if I was truly a 95% putter like I hypothesized, 5 out of 7 (71%) is not very good. In fact, it’s probably very rare for a 95% putter to ever go less than 6 for 7! How rare? The probability of a 95% putter making Y=x putts in 7 attempts can be expressed by the below equation:
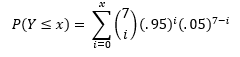
And the probability of a 95% putter making Y≤x putts in 7 attempts can be expressed by the below:
 (Note, for the purposes of this exercise, I am assuming that each putt is an independent trial whose result is unaffected by any other putt in the video). If you’re wondering where these equations came from, in this exercise we are treating Y as a binomial random variable.

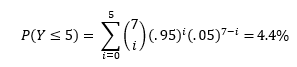
So, if I was truly a 95% putter, then the probability of me making less than or equal to 5 putts in 7 attempts is:

Remember, I want to use my putting video to test my hypothesis that I am indeed a 95% putter from 19 ft. Suppose that I create a testing procedure that says “If the observed outcome has a less than 5% chance of occurring, then reject the hypothesis.” Under this testing procedure, I would reject the hypothesis if 5 or less putts were made, but would accept the hypothesis if 6 or more were made. Thus, under this test, based on the first seven putts of my video, I’d reject the 95% hypothesis. How sad.

The testing procedure mentioned above has a major downfall. It had an extremely high probability of erroneously accepting the hypothesis, even if it was untrue. Suppose that my true putting percentage was 85%. Even under this lower putting percentage, it’s completely feasible that I could have made 6 or even 7 of my first 7 putts, causing us to NOT reject the hypothesis of 95%. Under the test described above, the probability of accepting the 95% hypothesis for an 85% putter is:

That means that even a putter much worse than 95% could easily trick the test into accepting the 95% hypothesis. Thus, the test is not very accurate with only seven putts. We can improve upon it with more trials! Let’s look into what happened for the rest of the video.

Suppose we follow the same testing procedure as we did before: “If the observed outcome has a less than 5% chance of occurring under when the existing hypothesis is true, then we reject said hypothesis.” However this time, instead of 7 putts as my sample size, I now have 50. This procedure would dictate that we reject the hypothesis for 44 or fewer made putts. Probability of observing this for a 95% putter is:

In the video, I made 46 of the 50 attempts, so under this test, we would NOT reject the 95% hypothesis. Hooray! But remember the downfall of our earlier test… that test had a high probability of accepting the 95% hypothesis for significantly worse putters than 95%. To contrast, let’s see how the new testing procedure does at weeding out 85% putters:
This result, compared to the 71.7% result from the initial testing procedure shows that a sample of 50 putts is far more accurate than a sample of just 7.

Even though the new test procedure based on 50 putts is an improvement from our earlier procedure based on 7 putts, it could be even better! Note, the probability that our test fails is equal to the sum of the two percentages in the equation above.

That’s a fairly high probability that our test will fail! If we choose to change our testing procedure so that we only reject when Y≤45, then we can improve the accuracy of the test.
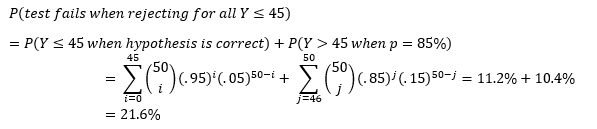
Thus, a testing procedure that rejects the hypothesis for all Y≤45 has a lower probability of failure than one that rejects for all Y≤44. In fact, the Y≤45 test is the most accurate testing procedure for testing a 95% hypothesis for a sample size of 50 putts.

There’s a lot to unpack in all of the equations and commentary above. And any time the summation operator appears, especially for large numbers, the math can become super tedious. That’s why I created the Putting Hypothesis Tester for you to use in your putting practice.

To use the tester:

  1. Download the file
    1. You may need to click Enable Content
  2. Click the Develop a new test button
  3. Follow the prompts
  4. View the testing parameters on the Summary Sheet
  5. Go putt to test your hypothesis!

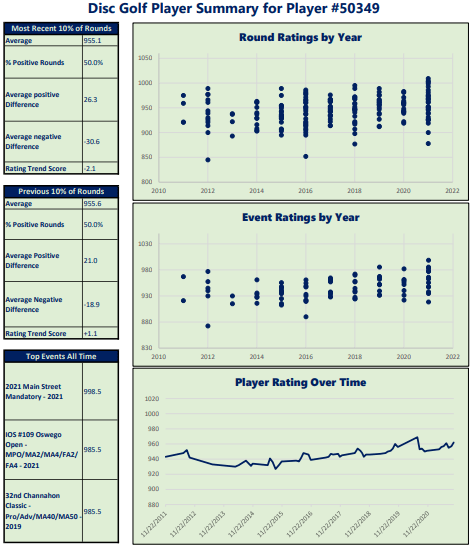
Introducing the Disc Golf Player Summary

It’s the start of Winter and for this Chicago Disc Golfer, the change of season has had a lot of meaningful implications:

  1. It’s dark outside when I leave work.
  2. Walking Gordon is not nearly as much fun as it was a couple months ago.
  3. Days that allow for enjoyable disc golf are few and far between.

Since I’m not able to practice nearly as much as I’d like to, my mind has had a little too much time to wander… a scary thought, I know.

With so much time on my hands, I began to reflect on the 2021 disc golf season. At the onset of this year, I made a conscious effort to rid myself of the “play-it-safe” mentality. Sometimes, this more aggressive approach worked out in my favor, other times not so much. It was fairly easy to track how my PDGA rating changed over the course of the year, but I began asking myself questions that weren’t as easy to find the answers to. Does an aggressive approach lead to greater round rating volatility? Conversely, does a conservative approach lead to more consistent round ratings? In what years were my top events of all time?

In general, I am a fan of the PDGA’s rating system (stay tuned for a blog-post explaining why), but a player’s rating at a given point in time fails to convey two vital pieces of information:

  1. It is not directional or predictive
  2. It is not indicative of volatility

It’s time consuming and tedious to go to a player’s PDGA page, get information on all the rounds and events they’ve played, then summarize the information in a way that allows for prediction. That’s why I developed the Disc Golf Player Summary, which instantly tells a deeper story of a disc golfer and their rating.

The Disc Golf Player Summary highlights trends from PDGA sanctioned tournament round performance (sanctioned leagues are not included). Specifically, it looks at how a player performs in a given round relative to their Player Rating at the time. When a player’s round rating is higher than their player rating at the time of the round, it is referred to as a positive round, and the difference between the round rating and the player’s rating at the time is called the positive round difference. For example, when a 950 rated player shoots a 980 rated round, the round is a positive round with a positive round difference of 30. Similarly, rounds below a player’s rating are considered negative rounds, with the difference between the player rating and round rating referred to as negative round difference. When a 950 player shoots a 920 rated round, this round is considered a negative round with negative round difference of -30. Here’s the information you’ll get out of the Player Summary:

What is the Probability of a Positive Round?

Since player rating is regularly changing, it is insufficient to use traditional traditional statistics like mean and standard deviation to predict player performance. Players who are regularly outperforming their player rating might be more likely to have success than their player rating would otherwise indicate. The Summary compares positive round likelihood from the most recent 10% of rounds to that of their previous 10% of rounds

What is Average Positive Round Difference? How about Average Negative Round Difference?

This number tells us how volatile the player is. When they shoot well, are they beating their player rating by a significant margin? Or are they always within a few points of their player rating? Conversely when they shoot poorly, are they completely falling apart, or are they salvaging their negative rounds to avoid plummeting down the leaderboard? Again, the Summary sheet compares these metrics from a player’s most recent 10% of rounds to their prior 10% of rounds.

Do the positive rounds outweigh the negative rounds?

This metric, coined the Rating Trend Score, can be thought of as expected points a player will shoot below or above their round rating. It is defined as:

% Positive Rounds * Average Positive Round Difference + % Negative Rounds * Average Negative Round Difference

Which events are the player’s best and when did they happen?

This fairly innocuous question is actually a kind of a beast to answer definitively on the PDGA player page, though its answer can provide significant insight into the direction a player is headed. If their top 3 events are all recent, then there’s a good chance they are on their way up the leaderboard at their local tournaments.

Here’s how the Player Summary works:

  1. Download the Excel document
    1. Upon opening click Enable Content if prompted
  2. Click the Generate the New Report button
  3. Enter in your PDGA # (or your friend’s, or Paul McBeth’s, whoever!)
  4. Enjoy the Player Summary…
  5. Repeat steps 2 through 4 indefinitely!