Hello Hyzermetricians, for tonight’s post I will be shining an insanely bright light on the latest video from my Instagram Live Garage Putting Series.
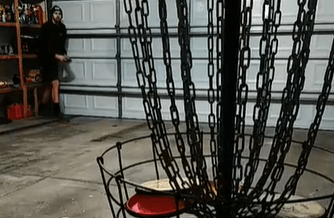
Alright, let’s set the stage. If you haven’t seen my live putting sessions before, most of them consist of fifty putts. Sometimes I bring in obstacles or I move the basket up onto a stair to mix things up, but for the purposes of last night’s video, I attempted 50 straightforward 19-foot putts.
I’d love to think that I should make 100% of these 19-footers, but sadly that is not (yet) the case. Instead, I hypothesized that my true putting percentage from this range was 95%. The rest of this post explains how I used my putting session last night to create a test of this hypothesis, and how you can perform a similar test too!
Suppose for a second that my hypothesis is correct, I am indeed a 95% putter from 19 ft. That doesn’t mean that I will always make 95% of my putts whenever I shoot a video. In fact, if I only attempt 50 putts at a time, it’s impossible to make exactly 95% of my putts. In some of my putting videos I’ll make more than 95% of my putts, in others I’ll make less. Given this variability, and the fact that I don’t actually know my true putting percentage, how can I ever determine if my hypothesis is accurate? Let’s find out. Roll the video!
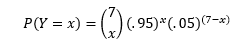
For starters, let’s look at the first seven putts from the video, of which I made five. It doesn’t take a math wizard to know that if I was truly a 95% putter like I hypothesized, 5 out of 7 (71%) is not very good. In fact, it’s probably very rare for a 95% putter to ever go less than 6 for 7! How rare? The probability of a 95% putter making Y=x putts in 7 attempts can be expressed by the below equation:
And the probability of a 95% putter making Y≤x putts in 7 attempts can be expressed by the below:
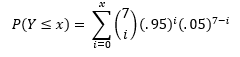
(Note, for the purposes of this exercise, I am assuming that each putt is an independent trial whose result is unaffected by any other putt in the video). If you’re wondering where these equations came from, in this exercise we are treating Y as a binomial random variable.
So, if I was truly a 95% putter, then the probability of me making less than or equal to 5 putts in 7 attempts is:
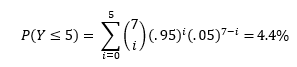
Remember, I want to use my putting video to test my hypothesis that I am indeed a 95% putter from 19 ft. Suppose that I create a testing procedure that says “If the observed outcome has a less than 5% chance of occurring, then reject the hypothesis.” Under this testing procedure, I would reject the hypothesis if 5 or less putts were made, but would accept the hypothesis if 6 or more were made. Thus, under this test, based on the first seven putts of my video, I’d reject the 95% hypothesis. How sad.
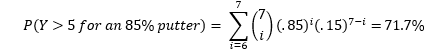
The testing procedure mentioned above has a major downfall. It had an extremely high probability of erroneously accepting the hypothesis, even if it was untrue. Suppose that my true putting percentage was 85%. Even under this lower putting percentage, it’s completely feasible that I could have made 6 or even 7 of my first 7 putts, causing us to NOT reject the hypothesis of 95%. Under the test described above, the probability of accepting the 95% hypothesis for an 85% putter is:
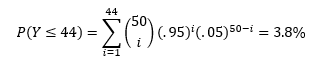
Suppose we follow the same testing procedure as we did before: “If the observed outcome has a less than 5% chance of occurring under when the existing hypothesis is true, then we reject said hypothesis.” However this time, instead of 7 putts as my sample size, I now have 50. This procedure would dictate that we reject the hypothesis for 44 or fewer made putts. Probability of observing this for a 95% putter is:

Even though the new test procedure based on 50 putts is an improvement from our earlier procedure based on 7 putts, it could be even better! Note, the probability that our test fails is equal to the sum of the two percentages in the equation above.

That’s a fairly high probability that our test will fail! If we choose to change our testing procedure so that we only reject when Y≤45, then we can improve the accuracy of the test.
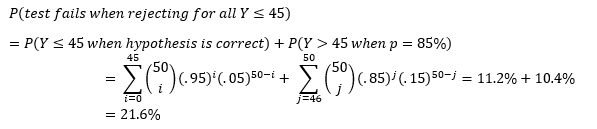
Thus, a testing procedure that rejects the hypothesis for all Y≤45 has a lower probability of failure than one that rejects for all Y≤44. In fact, the Y≤45 test is the most accurate testing procedure for testing a 95% hypothesis for a sample size of 50 putts.
There’s a lot to unpack in all of the equations and commentary above. And any time the summation operator appears, especially for large numbers, the math can become super tedious. That’s why I created the Putting Hypothesis Tester for you to use in your putting practice.

To use the tester:
- Download the file
- You may need to click Enable Content
- Click the Develop a new test button
- Follow the prompts
- View the testing parameters on the Summary Sheet
- Go putt to test your hypothesis!

[…] my most recent post I introduced a process to estimate the probability of me making a putt in my garage. I also […]
LikeLike