Fantasy sports platform Sleeper has developed an API to give players access to a trove of league-specific data that is not publicly accessible on other platforms. Things like like historical roster makeup, results over time, and setting changes are now easily viewable by anyone who plays fantasy on Sleeper. Needless to say, the Sleeper API represents a perfect opportunity to build and share a user-friendly, Excel based tool.
Most Fantasy Football leagues operate under slightly different sets of rules. In the league I run, we’ve implemented some unique payouts during our regular season. The top two scorers each week get $5, and everyone who wins a regular season match gets $4. As commissioner, one of my duties is to track these payouts over the course of the season so that each player gets the correct amount at the end of the year. This used to be a task that I loathed with a fiery passion!
When we started these payouts I had to manually enter scores from our league into a spreadsheet to calculate the correct amounts. This annoying process often led to mistakes and miscalculations. Thankfully those days are over now that I have the Hyzermetrics Fantasy Football Payout Tracker!
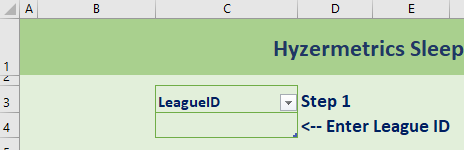
The tracker gives commissioners the ability to track custom payout structures in their league. It relies on the LeagueID, which is can be found on your browser any time you access your league.
Once you have your LeagueID, enter it into cell C4 of the tracker.
Next, populate your payouts! You can have a prize for a weekly win, and you can assign prizes for each position.
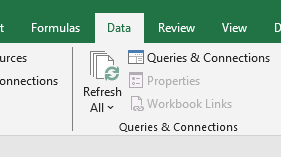
Finally, go up to the Data ribbon and click Refresh All. The first time you do this, you may see a pop-up about privacy levels. In this case, you can check the “Ignore Privacy Levels” checkbox.
Congrats, once you’ve gone through these steps you will now have a functioning payout calculator! Refresh it each week to update the payout amounts. Hopefully this tool will save my fellow commissioners a headache or two this Fantasy Football season.
A couple years ago, my Fantasy Football league passed a rule that said our draft order would be determined by lottery each year. As commissioner, it was my job to implement this rule. My initial idea was to buy an actual full-blown lottery ball machine. How cool would that be?! But due a combination of frugality and laziness, I never actually ended up buying one. I also debated using the tried-and-true “numbers out of a hat” method. It was simple and would get the job done, but I decided that I wanted to create something with a little flair.
Enter the Lotto Simulator. This spreadsheet has the ability to run a couple different types of lotteries, and the fun part, as always, is in the math! Now, there’s a whole lot of interesting math we can do for lotteries like this, and maybe I’ll do a super deep dive in a future post. But today, I’ll focus only on what I automated in the Lotto Simulator spreadsheet, just please know that this is only scratching the surface!
Draft lotteries can be set up in a couple different ways. For our Fantasy Football league, we set it up as follows:
Each team is assigned between 1 and 10 lottery balls based on their finish in the previous regular season
5th place – 10 balls
6th place – 9 balls
7th – 8 balls
8th – 7 balls
9th – 6 balls
10th – 5 balls
4th – 4
3rd – 3
2nd – 2
1st – 1
When someone’s lottery ball is selected, they get to pick their draft position
What is the most likely outcome of our league’s draft lottery, and what is the probability of that happening?
The most likely outcome is that for each draw, the event with the highest probability occurs. Based on the Plackett-Luce model, doing this ten times gives us:
Given our league’s lottery setup:
After identifying the probability of the max likelihood outcome above, suppose we run a lottery that yields the below selection order:
7th place – 8 balls
8th place – 7 balls
6th place – 9 balls
5th place – 10 balls
2nd place – 2 balls
9th place – 6 balls
10th place – 5 balls
1st place – 1 ball
4th place – 4 balls
3rd place – 3 balls
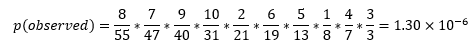
It’s reasonable to ask “What was the probability of the observed result?” The lotto spreadsheet gives us the answers to this question!
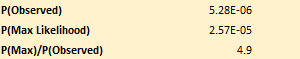
The probability of observing our result is:
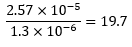
Unfortunately, this number doesn’t tell us much on its own. It’s a tiny number, but so too is our max likelihood number we derived earlier. How do we make sense of it all? The p(Max)/p(Observed) ratio is our answer! This number tells us how many times more likely we are to see the max likelihood outcome than the observed outcome for a given lottery. In the example of my league, this ratio is equal to:
This means that we are 19.7 times more likely to observe the max likelihood result than the result we observed.
Let’s do the same lottery again. Suppose that our second lottery gives these results:
7th place – 8 balls
5th place – 10 balls
9th place – 6 balls
4th place – 4 balls
10th place – 5 balls
6th place – 9 balls
3rd place – 3 balls
8th place – 7 balls
2nd place – 2 balls
1st place – 1 ball
From this lottery, our p(max)/p(observed) ratio is 4.9…. so we can say that the result of the second lottery was a far more likely outcome than the result of the first!
And there we have it. The Lotto Simulator spreadsheet not only runs a lottery, but it also gives us a surface level understanding of the results we observe. Now, when your league-mates complain that a lottery is “rigged,” you can use the Lotto spreadsheet to see just how unusual the results of your lottery are.
Here’s what to do:
Download the Lotto Simulator spreadsheet
You many need to click “Enable Content” to enable macros
Choose the type of lottery you want to run
In addition to the Draft Lottery discussed in this article, the spreadsheet also has a built in Traditional Lottery option. Try it out!
Run the Lotto Simulator spreadsheet for any and all of your lottery needs!
In my most recent post I introduced a process to estimate the probability of me making a putt in my garage. I also provided a tool for others to do the same (though one doesn’t necessarily need to be in their garage if the weather cooperates). In that exercise, I assumed that each putt had an equal probability of success, and the number of putts made in a series of fifty attempts could be represented by random variable with a Binomial probability distribution.
Shifting gears, suppose that instead of garage putts, we instead perform a different series of tests:
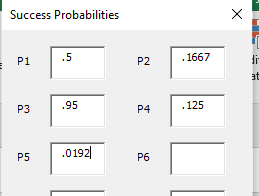
Flip a coin, success if heads p(success) = .5
Roll a six-sided die, success if a six is rolled p(success) = .1667
Go out to my garage and make a putt that has a 95% success probability p(success)= .95
Roll an eight-sided die, success if an eight is rolled p(success) = .125
Correctly guess a card pulled at random from a standard deck of 52 cards p(success) = .0192
With this series of tests, we can ask “what is the probability that we’ll see x successes?” But sadly, our beloved Binomial distribution is not sufficient to answer this question.
Before we deep-dive into the solution, let’s eyeball this series of tests and see if we can make any guesses as to what the outcome is likely to be. It seems like it would be extremely unlikely to see less than one success in this series of tests, because one trial in the bunch, the 95% garage putt, has a very high probability of success. The probability of missing that putt AND missing all the others would seem pretty low. But other than the putt and the coin flip, all the other tests seem like they’re pretty unlikely to hit, so it seems like we probably won’t see three or more successes.
If we let K = the # of successes in our weird series of trials, then K takes on a Poisson Binomial Distribution, which is similar to the Binomial Distribution except the probability of success varies with each trial. If we wanted to see the probability of observing exactly three successes, we would need to analyze the probability of each possible outcome that contains three successes and add their probabilities. If we denote 1 as a success and 0 as a failure, then we can use the below chart to identify P(K = 3)
Every possible outcome that contains exactly three successes
Adding these up gives us the probability of observing exactly three successes in our series of trials:
As you can see, the math for finding the p(K = k) for a Poisson Binomial random variable can be fairly tedious, especially as the number of trials increases. In fact, for n trials, the number of different outcomes that need to be individually analyzed is equal to 2n and for any number of successes k:
where Fk is the subset of all subsets of k integers that can be selected from n trials and Ac is the complement of A.
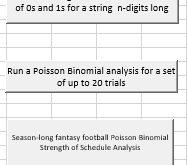
For more than a couple trials, the arithmetic can amount to quite a lot of work! There are a number of fancy stats software programs out there that might be able to help, but fortunately I’ve developed a way to do it in Excel! In the Poisson Binomial – Fantasy Football Strength of Schedule worksheet, you can run a Poisson Binomial analysis for a set of up to 20 trials! Let’s use it for our series of tests discussed earlier.
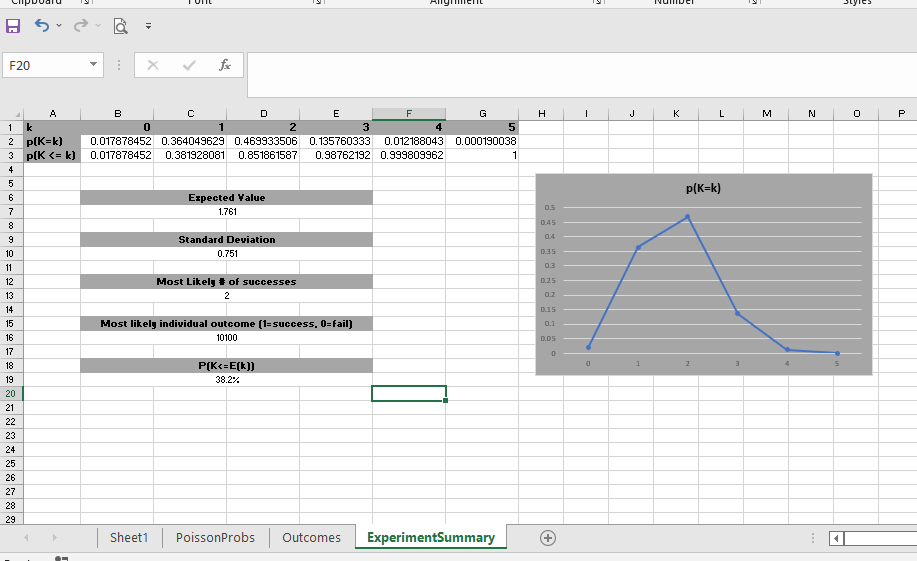
In seconds, the worksheet shows exactly how many successes I can expect to have along with probabilities for each possible number of successes. As we discussed earlier when we were just eyeballing the set of tests, the probability of observing k=0 successes is very low, less than 2%. But it is even more unlikely for us to observe k>=4 successes! The number of successes we are most likely to observe in this series of tests is 2.
We now have a way to run a quick analysis of a Poisson Binomial Distributed random variable in MS Excel! Try it out for yourself, then let’s explore an application.
Application: Fantasy Football Strength of Schedule
How many times has your fantasy football team had a fantastic week only to suffer a loss to the only team in the league with more points than you? Conversely, have you ever been pleasantly surprised as you skate through the season with mediocre performances that happen to come against teams that do even worse? Until now, it was difficult to quantify and compare exactly how lucky or unlucky fantasy players were over the course of a season.
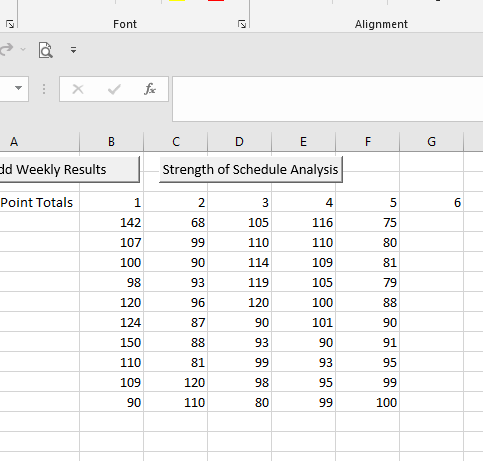
Suppose that we were to hide the weekly matchups in your fantasy football league and instead we only saw each team’s point totals each week. We’d be able to get a pretty good idea of how many wins each league participant should have throughout the season, then we could compare that number to the number of wins they actually have. Using this comparison, we can determine if a fantasy team has had a hard schedule or an easy one.
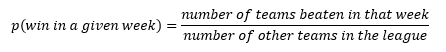
The probability that a team will win their fantasy football match in a given week is a function of the rank of their score in that week. If a team finishes first in points in a given week, then they’re guaranteed to win, no matter who the schedule has them playing against that week. If they finish last in points for the week, then no amount of good fortune will save them, and they will lose. A team that finishes second in points during a given week is probably going to win, but there’s a small chance the schedule has them matched up against the team that finishes first, in which case they will suffer an unfortunate loss! In general, the probability of a win can be expressed as follows:
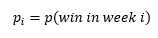
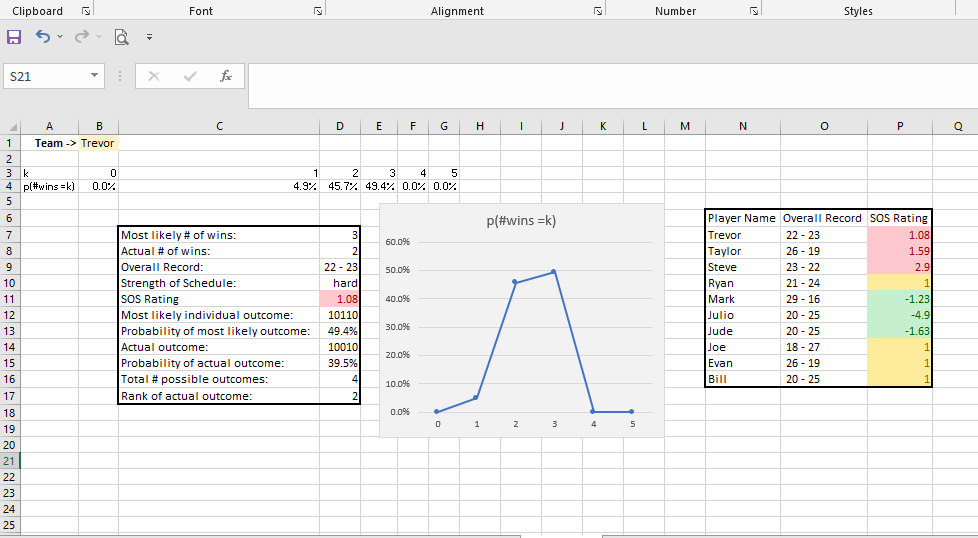
If we do this over the course of the season of n weeks, we can generate set of probabilities that we can use in a Poisson Binomial analysis with:This analysis tells us the exact probability that each team will win any number of games throughout the year. We can then compare these probabilities against the number of wins each team ACTUALLY has. This tells us who which teams are lucky and which ones aren’t.
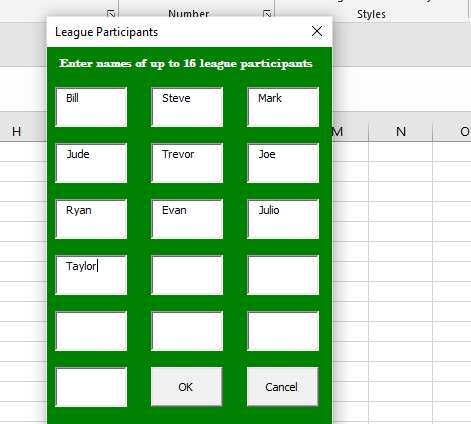
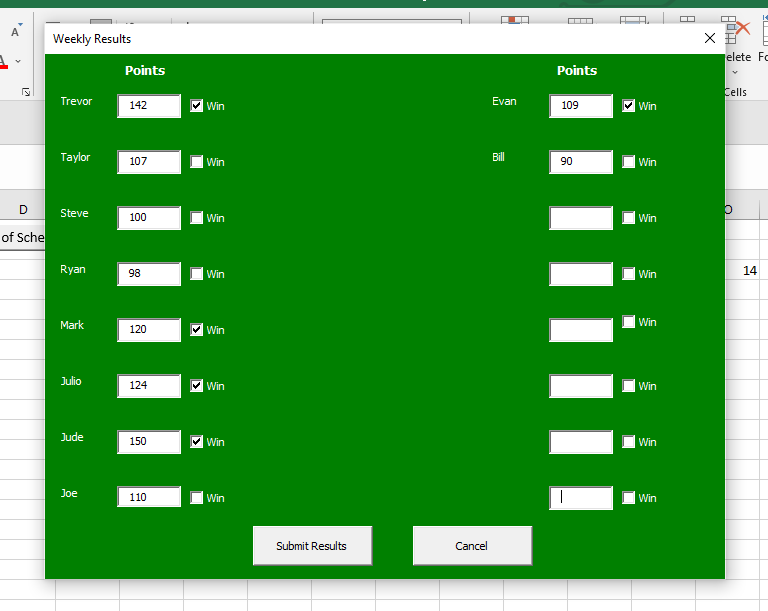
Once again, we now have a tool to help in the Poisson Binomial – Fantasy Football Strength of Schedule worksheet. To run the analysis for your league, click on the Season-long fantasy football Poisson Binomial Strength of Schedule Analysis button on the spreadsheet and enter in the names of up to 16 league participants. Then enter in your results each week and enjoy! Stay tuned next fantasy season where I will interpret the actual results of this analysis for my fantasy football leagues!
Here’s what to do:
Download the Poisson Binomial Fantasy Football SOS worksheet
Enable Macros
Choose the mode you’d like to run
Generate a simple list of all combinations of 0 and 1 up to 20 digits long
Run a Poisson Binomial Analysis for up to 20 trials
Start a full season fantasy football Strength of Schedule analysis
Run a strength of Schedule analysis at any point in the season!