Alrighty folks, we are a mere 20 minutes away from the start of ESPN’s 2022 NBA Draft Lottery Coverage! I’m going to kick the night off by running a simulation of 150 trials from the Hyzermetrics NBA Draft Lottery Simulator. For this initial run, I won’t be fixing any draft positions or anything, just going to change the number of repetitions and let it ride. I’ll be back with the results shortly.
7:56 PM ET
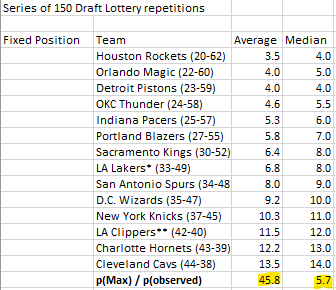
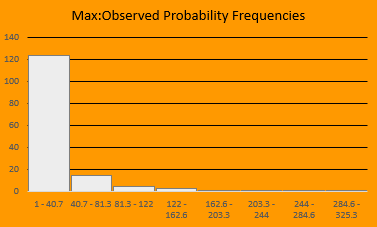
Alright, the results of our set of 150 trials are in. As expected, the Rockets, Magic, Pistons, and Thunder finished with the highest average and median draft positions. Nothing too crazy here. What I would like to focus on is our famous p(max)/p(observed) likelihood ratio stat that I’ve talked about at length in past articles. For the series of 150 repetitions that we just ran, the average ratio was 45.8, which seems relatively high, but check out the median… it’s only 5.7. This means that half of the random trial reps we just ran came in with a max:observed likelihood ratio at or under 5.7. As we go through the lottery, this median number is important to note, as we can benchmark the likelihood ratio that we’re about to observe against this unadulterated 5.7 median in our initial set of trials.
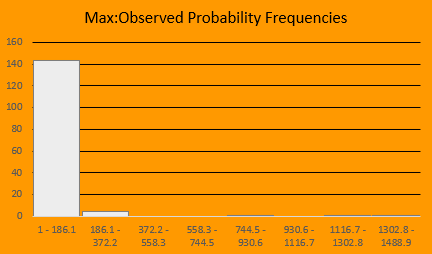
Median likelihood ratio of 5.7 will be used to benchmark the actual result at the end of the lottery143 of the 150 reps ended with p(max)/p(observed) less than 186.1…
8:07 PM ET
Doing a little digging into the numbers from our initial set of trials. There were some really unlikely outcomes that brought the average likelihood ratio way up! In fact 132 of the 150 trials had a max:observed likelihood ratio under the average of 45.8. Based on this, I’d be relatively surprised if the observed result of the NBA Draft Lottery has a ratio greater than the median of 5.7, and I’d be downright shocked if it we see an outcome with a ratio that exceeds 45.8.
8:13 PM ET
Ok, ESPN let’s announce the results already.
8:21 PM ET
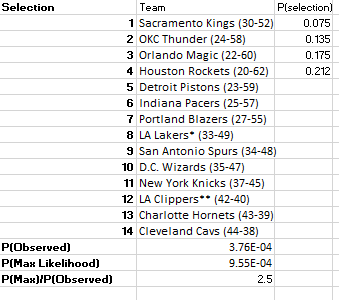
Alright, we are pretty much locked to get a very chalk-y result here. We know that the Kings are picking in the top 4… the least likely result remaining is 1) Kings, 2) Thunder, 3) Magic, 4) Rockets. Let’s see what that result would look like from a probability perspective…
This result, which is the least likely outcome we could observe given the remaining four teams, would have a likelihood ratio of 2.5
8:30 PM ET
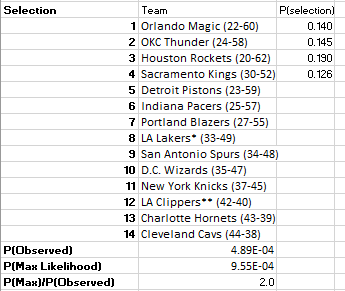
The results are in! The first four picks in the 2022 NBA Draft will be:
Orlando Magic
OKC Thunder
Houston Rockets
Sacramento Kings
Let’s run another simulation with this result built in as fixed:
With p(max)/p(observed) roughly equal to 2, the actual result of the 2022 NBA Draft Lottery was about half as likely to occur than the most likely outcome. Based on our initial series of trials, this result is rather unremarkable, however there are two important observations we made in the Draft Lottery that were unlikely:
The Kings got a top 4 pick
The Rockets draft after the OKC Thunder
To conclude the evening, I am already preparing the enhancements for next year’s NBA Draft Lottery, can’t wait to share them with you! Thanks for joining for the first Hyzermetrics Live NBA Draft Lottery Simulation!
The day we’ve all been waiting for is finally here! That’s right, we are just one week away from the 2022 NBA Draft Lottery! And fortunately, Hyzermetrics has just the tool to help you and your crew commemorate the occasion.
If you need a refresher on the mechanics of the NBA Draft Lottery, don’t worry, we’ve got you covered. Here’s how it works:
“The 38th annual NBA Draft Lottery will determine the order of selection for the first 14 picks of the 2022 NBA Draft. Drawings will be conducted to determine the first four picks in the NBA Draft. The remainder of the lottery teams will select in positions five through 14 in inverse order of their 2021-22 regular-season records…
Fourteen ping-pong balls numbered 1 through 14 will be placed in a lottery machine. There are 1,001 possible combinations when four balls are drawn out of 14, without regard to their order of selection. Before the lottery, 1,000 of those 1,001 combinations will be assigned to the 14 participating lottery teams…
The Draft selections for the remainder of the first round (No. 15-30) and the entire second round (No. 30-60), are determined by reverse order of regular season record. Each NBA team gets one selection in the first round and one selection in the second round.”
The first tidbit to note is that at first glance, the NBA Draft Lottery is set up a little bit differently than the Hyzermetrics Fantasy Draft Lottery Simulator. That said, we can actually re-configure the Hyzermetrics Fantasy Draft Lottery to match this procedure… instead of assigning ball numbers to Lottery participants, we assign “combination numbers” to each participant and pull four combination numbers out of the Hyzermetrics Lottery Machine. Here’s what this year’s set up will be:
Team
# Combinations
Min Combo Num
Max Combo Num
Houston Rockets (20-62)
140
1
140
Orlando Magic (22-60)
140
141
280
Detroit Pistons (23-59)
140
281
420
OKC Thunder (24-58)
125
421
545
Indiana Pacers (25-57)
105
546
650
Portland Blazers (27-55)
90
651
740
Sacramento Kings (30-52)
75
741
815
LA Lakers* (33-49)
60
816
875
San Antonio Spurs (34-48)
45
876
920
D.C. Wizards (35-47)
30
921
950
New York Knicks (37-45)
20
951
970
LA Clippers** (42-40)
15
971
985
Charlotte Hornets (43-39)
10
986
995
Cleveland Cavs (44-38)
5
996
1000
Before we dive in, there are some really great articles and resources on the subject of the NBA Draft Lottery, and even a cool web-based simulator that you should check out. Once you’re done with those, you will not want to miss the cool features in the Excel based Draft Lotto Simulator to take your knowledge of the NBA Draft Lottery to the next level.
Lotto Simulator: 2022 NBA Draft Lottery Edition
To recap, here are some high level facts about the NBA Draft Lottery:
The 14 teams that did not make the playoffs participate in the Draft Lottery
14 ping-pong balls numbered 1-14 are placed into the lottery machine
To determine the first pick, four ping-pong balls are chosen. The (non-ordered) combination of numbers drawn represents the winning combination.
Example of a winning combination might be: 6, 13, 10, 3. Whichever team has this combination assigned to them will get the first pick
To determine picks 2-4, the same process as above is performed, discarding any combinations of teams that have already been drawn
Picks 5-14 are determined in reverse Regular Season Standings order.
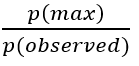
This ratio gives us an idea of just how unusual an observation in a particular lottery is. It tells us precisely how many times more likely we are to see the maximum likelihood outcome of a given lottery than we are to see a particular observation. Once we have this ratio, we can then compare this result to other lottery results to see which ones were more or less likely to occur. As an example If the ratio is equal to 2.0, then the max likelihood outcome is two times as likely to occur than the observed outcome. The minimum possible p(max)/p(observed) ratio is 1.0.
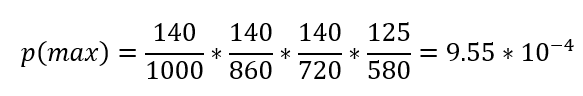
For the NBA Draft Lottery p(max) is calculated as follows:
Note that there are actually six different outcomes that have this probability. The outcomes that share this probability are:
Rockets, Magic, Pistons, Thunder
Magic, Rockets, Pistons, Thunder
Pistons, Rockets, Magic, Thunder
Magic, Pistons, Rockets, Thunder
Rockets, Pistons, Magic, Thunder
Pistons, Magic, Rockets, Thunder
The NBA Draft Lottery Simulator is fully prepared to help you analyze the lottery trials you run. Here’s what you can do with it:
Run a simple NBA Draft Lottery simulation and tell you the Max:Outcome likelihood ratio for the trial
Run a series of up to 150 Draft Lottery simulations and show you statistics describing the trials
Fix the draft location of one or more teams to see how probabilities and selections are impacted
Let’s run through some examples!
Run a simple Draft Lottery
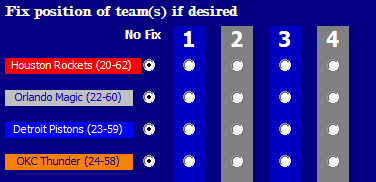
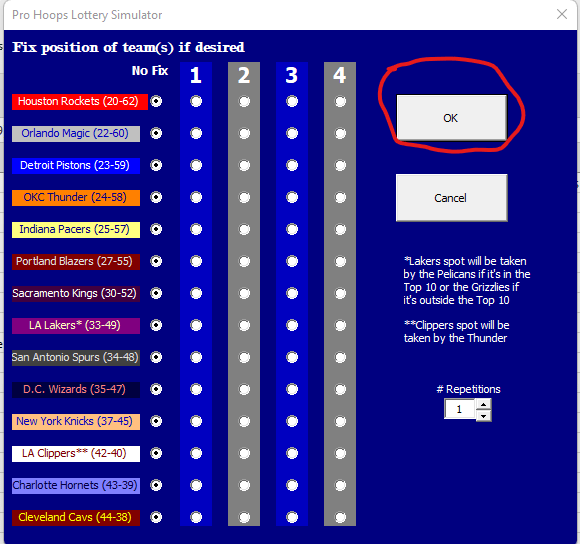
Click on the blue NBA Draft Lottery button
Press OK
View the results of the trail. In the trial screenshotted below, the outcome was fairly chalky… the Thunder got the first pick, then the top likelihood teams got each of the next three picks for a p(max)/p(observed) of 1.6
Run a series of up to 150 Draft Lottery simulations and show you statistics describing the trials
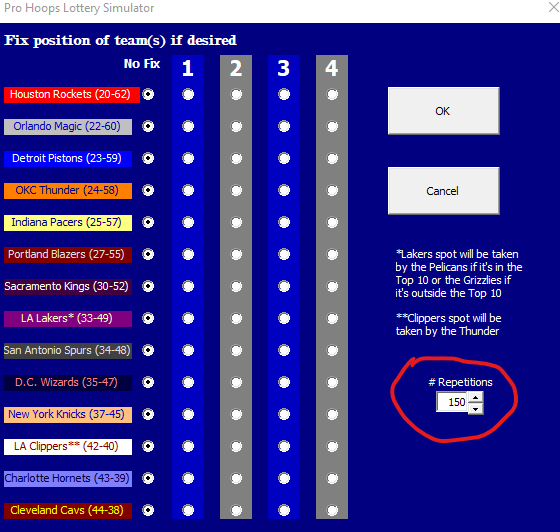
Click on the blue NBA Draft Lottery button
Select the desired number of repetitions
Press OK
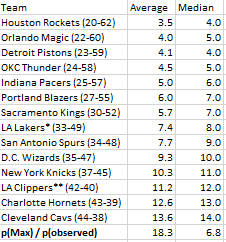
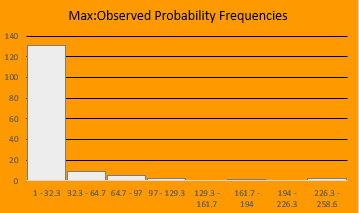
The simulator will run the specified number of simulations and create a new sheet to tell you all about the results! Here are some stats about the simulation we just ran:
In this series of 150 trials, we can see that the Magic had an average draft position of 4.0 and a median draft position of 5.0.
Average p(max)/p(observed) was 18.3, while the median 6.8
131 of the 150 trials had a p(max)/p(observed) between 1 and 32.3
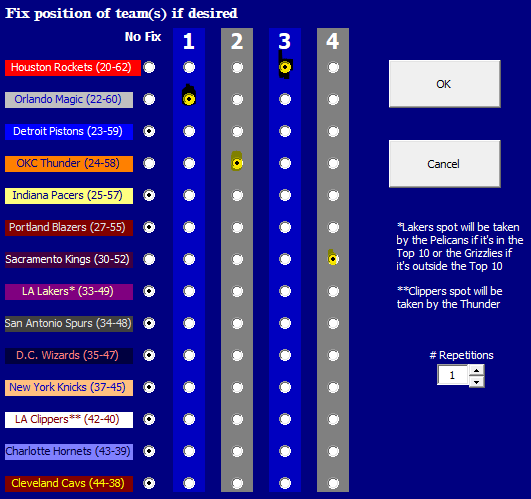
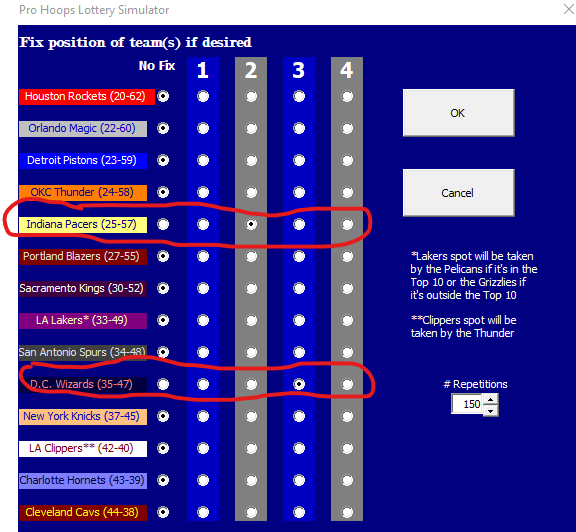
Fix the draft location of one or more teams to see how probabilities and selections are impacted
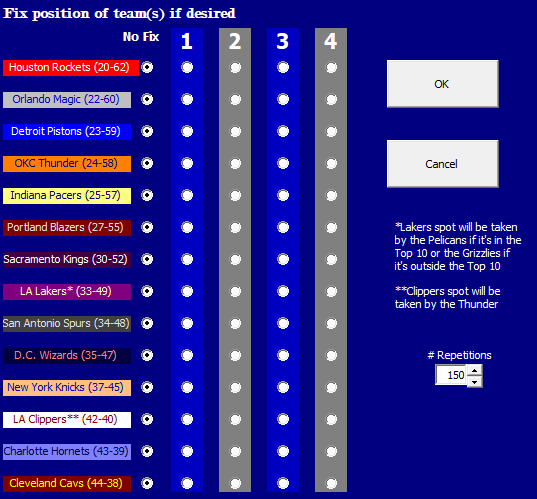
Click on the blue NBA Draft Lottery button
Select the draft positions of the teams you’re interested in fixing for the simulation. In this experiment, I am looking to run a simulation of outcomes when the Pacers get selected to pick 2nd AND the Wizards get selected to pick 3rd.
Select the desired number of repetitions
Press OK
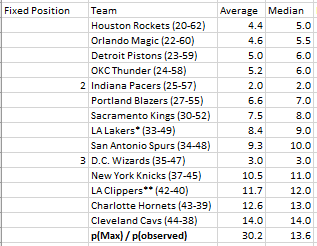
The simulator will run the specifiednumber of simulations and create a new sheet to tell you about the results… but wait… The teams you chose are fixed in the draft positions you selected! Under the conditions I specified in step 2, we can see that both the average and median of p(max)/p(observed) is much higher than when we didn’t specify any conditions. The whackier the conditions, the higher these ratios will be!
Try out the Simulator for yourself, and stay tuned to Hyzermetrics on May 17th as we Live Simulate the NBA Draft Lottery in real-time!