
In my most recent post I introduced a process to estimate the probability of me making a putt in my garage. I also provided a tool for others to do the same (though one doesn’t necessarily need to be in their garage if the weather cooperates). In that exercise, I assumed that each putt had an equal probability of success, and the number of putts made in a series of fifty attempts could be represented by random variable with a Binomial probability distribution.
Shifting gears, suppose that instead of garage putts, we instead perform a different series of tests:
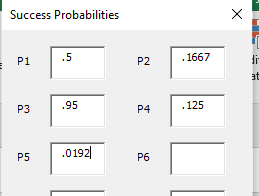
- Flip a coin, success if heads p(success) = .5
- Roll a six-sided die, success if a six is rolled p(success) = .1667
- Go out to my garage and make a putt that has a 95% success probability p(success)= .95
- Roll an eight-sided die, success if an eight is rolled p(success) = .125
- Correctly guess a card pulled at random from a standard deck of 52 cards p(success) = .0192
With this series of tests, we can ask “what is the probability that we’ll see x successes?” But sadly, our beloved Binomial distribution is not sufficient to answer this question.
Before we deep-dive into the solution, let’s eyeball this series of tests and see if we can make any guesses as to what the outcome is likely to be. It seems like it would be extremely unlikely to see less than one success in this series of tests, because one trial in the bunch, the 95% garage putt, has a very high probability of success. The probability of missing that putt AND missing all the others would seem pretty low. But other than the putt and the coin flip, all the other tests seem like they’re pretty unlikely to hit, so it seems like we probably won’t see three or more successes.
If we let K = the # of successes in our weird series of trials, then K takes on a Poisson Binomial Distribution, which is similar to the Binomial Distribution except the probability of success varies with each trial. If we wanted to see the probability of observing exactly three successes, we would need to analyze the probability of each possible outcome that contains three successes and add their probabilities. If we denote 1 as a success and 0 as a failure, then we can use the below chart to identify P(K = 3)
| 00111 | p(test 1 fails)*p(test 2 fails)*p(test 3 succeeds)*p(test 4 succeeds)*p(test 5 succeeds) | 0.095% |
| 01011 | p(test 1 fails)*p(test 2 succeeds)*p(test 3 fails)*p(test 4 succeeds)*p(test 5 succeeds) | 0.001% |
| 10011 | p(test 1 succeeds)*p(test 2 fails)*p(test 3 fails)*p(test 4 succeeds)*p(test 5 succeeds) | 0.005% |
| 01101 | p(test 1 fails)*p(test 2 succeeds)*p(test 3 succeeds)*p(test 4 fails)*p(test 5 succeeds) | 0.133% |
| 10101 | p(test 1 succeeds)*p(test 2 fails)*p(test 3 succeeds)*p(test 4 fails)*p(test 5 succeeds) | 0.665% |
| 11001 | p(test 1 succeeds)*p(test 2 succeeds)*p(test 3 fails)*p(test 4 fails)*p(test 5 succeeds) | 0.007% |
| 01110 | p(test 1 fails)*p(test 2 succeeds)*p(test 3 succeeds)*p(test 4 succeeds)*p(test 5 fails) | 0.971% |
| 10110 | p(test 1 succeeds)*p(test 2 fails)*p(test 4 succeeds)*p(test 4 succeeds)*p(test 5 fails) | 4.853% |
| 11010 | p(test 1 succeeds)*p(test 2 succeeds)*p(test 3 fails)*p(test 4 succeeds)*p(test 5 fails) | 0.051% |
| 11100 | p(test 1 succeeds)*p(test 2 succeeds)*p(test 3 succeeds)*p(test 4 fails)*p(test 5 fails) | 6.795% |
Adding these up gives us the probability of observing exactly three successes in our series of trials:

As you can see, the math for finding the p(K = k) for a Poisson Binomial random variable can be fairly tedious, especially as the number of trials increases. In fact, for n trials, the number of different outcomes that need to be individually analyzed is equal to 2n and for any number of successes k:

where Fk is the subset of all subsets of k integers that can be selected from n trials and Ac is the complement of A.
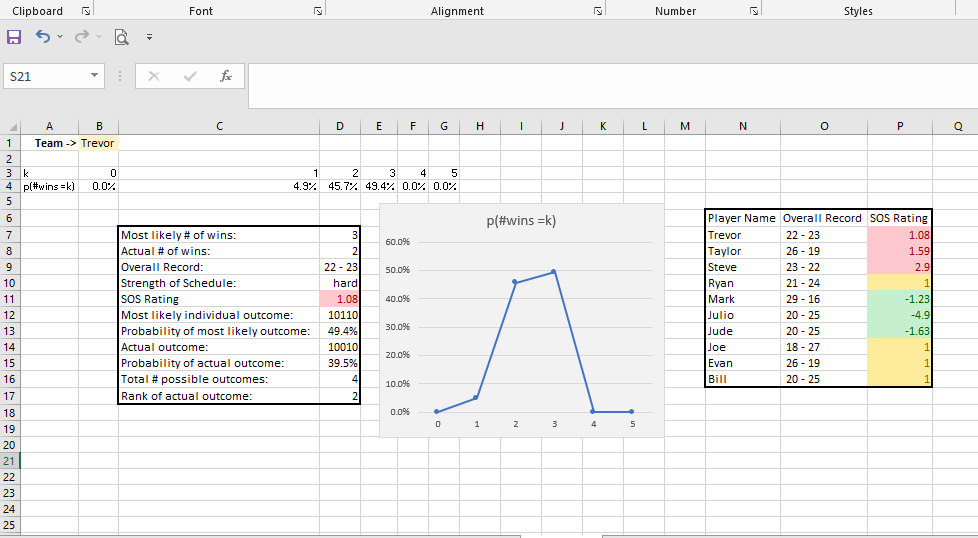
For more than a couple trials, the arithmetic can amount to quite a lot of work! There are a number of fancy stats software programs out there that might be able to help, but fortunately I’ve developed a way to do it in Excel! In the Poisson Binomial – Fantasy Football Strength of Schedule worksheet, you can run a Poisson Binomial analysis for a set of up to 20 trials! Let’s use it for our series of tests discussed earlier.
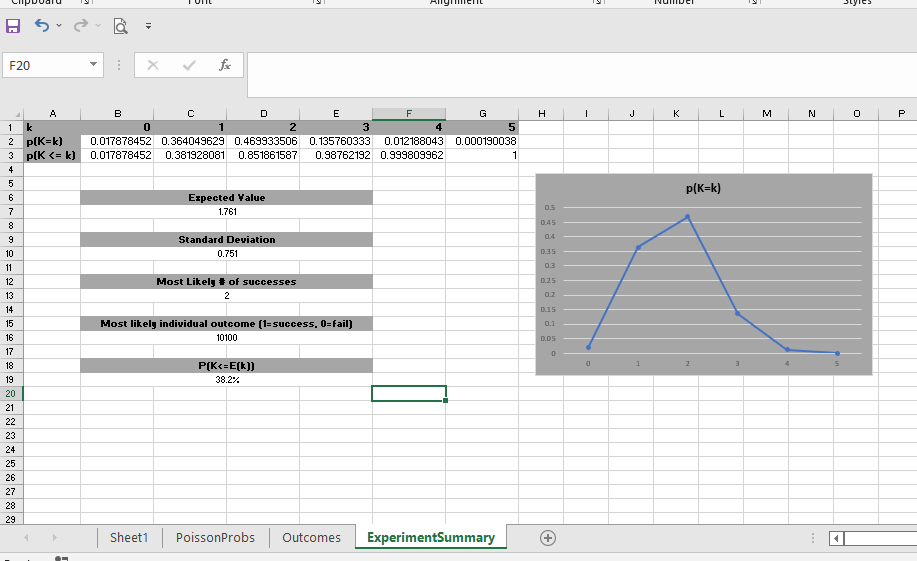
In seconds, the worksheet shows exactly how many successes I can expect to have along with probabilities for each possible number of successes. As we discussed earlier when we were just eyeballing the set of tests, the probability of observing k=0 successes is very low, less than 2%. But it is even more unlikely for us to observe k>=4 successes! The number of successes we are most likely to observe in this series of tests is 2.
We now have a way to run a quick analysis of a Poisson Binomial Distributed random variable in MS Excel! Try it out for yourself, then let’s explore an application.
Application: Fantasy Football Strength of Schedule
How many times has your fantasy football team had a fantastic week only to suffer a loss to the only team in the league with more points than you? Conversely, have you ever been pleasantly surprised as you skate through the season with mediocre performances that happen to come against teams that do even worse? Until now, it was difficult to quantify and compare exactly how lucky or unlucky fantasy players were over the course of a season.
Suppose that we were to hide the weekly matchups in your fantasy football league and instead we only saw each team’s point totals each week. We’d be able to get a pretty good idea of how many wins each league participant should have throughout the season, then we could compare that number to the number of wins they actually have. Using this comparison, we can determine if a fantasy team has had a hard schedule or an easy one.
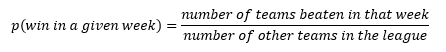
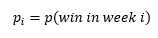
The probability that a team will win their fantasy football match in a given week is a function of the rank of their score in that week. If a team finishes first in points in a given week, then they’re guaranteed to win, no matter who the schedule has them playing against that week. If they finish last in points for the week, then no amount of good fortune will save them, and they will lose. A team that finishes second in points during a given week is probably going to win, but there’s a small chance the schedule has them matched up against the team that finishes first, in which case they will suffer an unfortunate loss! In general, the probability of a win can be expressed as follows:
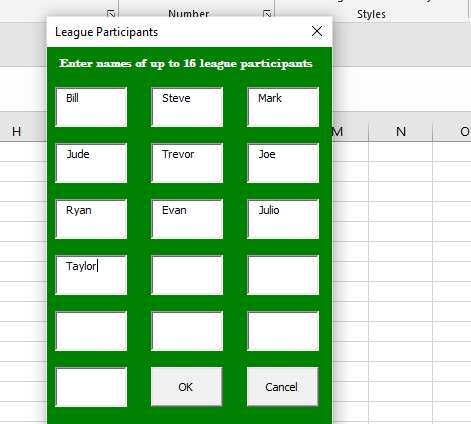
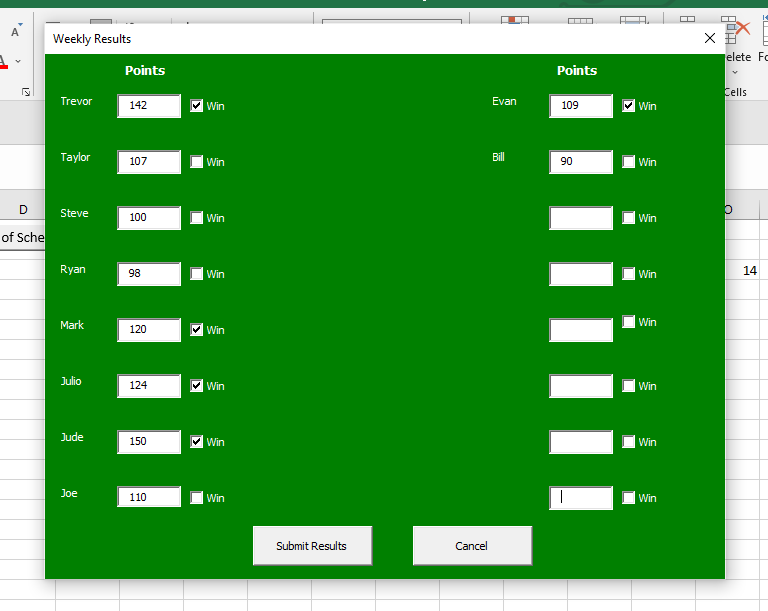
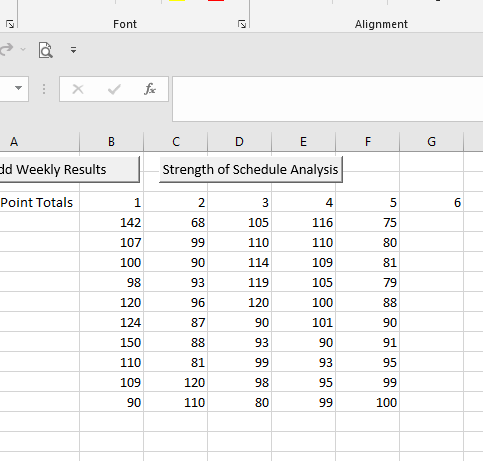
Once again, we now have a tool to help in the Poisson Binomial – Fantasy Football Strength of Schedule worksheet. To run the analysis for your league, click on the Season-long fantasy football Poisson Binomial Strength of Schedule Analysis button on the spreadsheet and enter in the names of up to 16 league participants. Then enter in your results each week and enjoy! Stay tuned next fantasy season where I will interpret the actual results of this analysis for my fantasy football leagues!
Here’s what to do:
- Download the Poisson Binomial Fantasy Football SOS worksheet
- Enable Macros
- Choose the mode you’d like to run
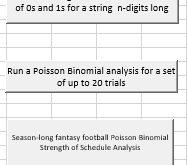
- Generate a simple list of all combinations of 0 and 1 up to 20 digits long
- Run a Poisson Binomial Analysis for up to 20 trials
- Start a full season fantasy football Strength of Schedule analysis
- Run a strength of Schedule analysis at any point in the season!
